pak::pkg_install("plotthis")Basic Information
I noticed a new R package called “plotthis” produced byundefined. This package could generate publication ready plots with simple commands, which largely simplified the R plotting process.
The manual: https://jbengler.github.io/tidyplots/
It is based on ggplot2 system, it is also very easy to add more features as we want.
Installation
The development version could be installed with
pak::pkg_install("pwwang/plotthis")Plotting Demo
library(plotthis)Clustree Plot
| p.0.4 | p.0.5 | p.0.6 | p.0.7 | p.0.8 | p.0.9 | p.1 | split |
|---|---|---|---|---|---|---|---|
| B | A | F | G | G | J | Z | 2 |
| D | E | A | H | A | D | I | 1 |
| C | F | G | G | C | H | NA | 2 |
| A | C | B | B | C | E | L | 1 |
| A | E | A | E | H | H | B | 1 |
| A | E | B | B | B | E | T | 2 |
ClustreePlot(data, prefix = "p")Registered S3 method overwritten by 'gglogger':
method from
+.gg ggplot2
I just realized that you might set the height and width of plots carefully, as this package dose not fit the size of your screen automatically, it is a small shortage.
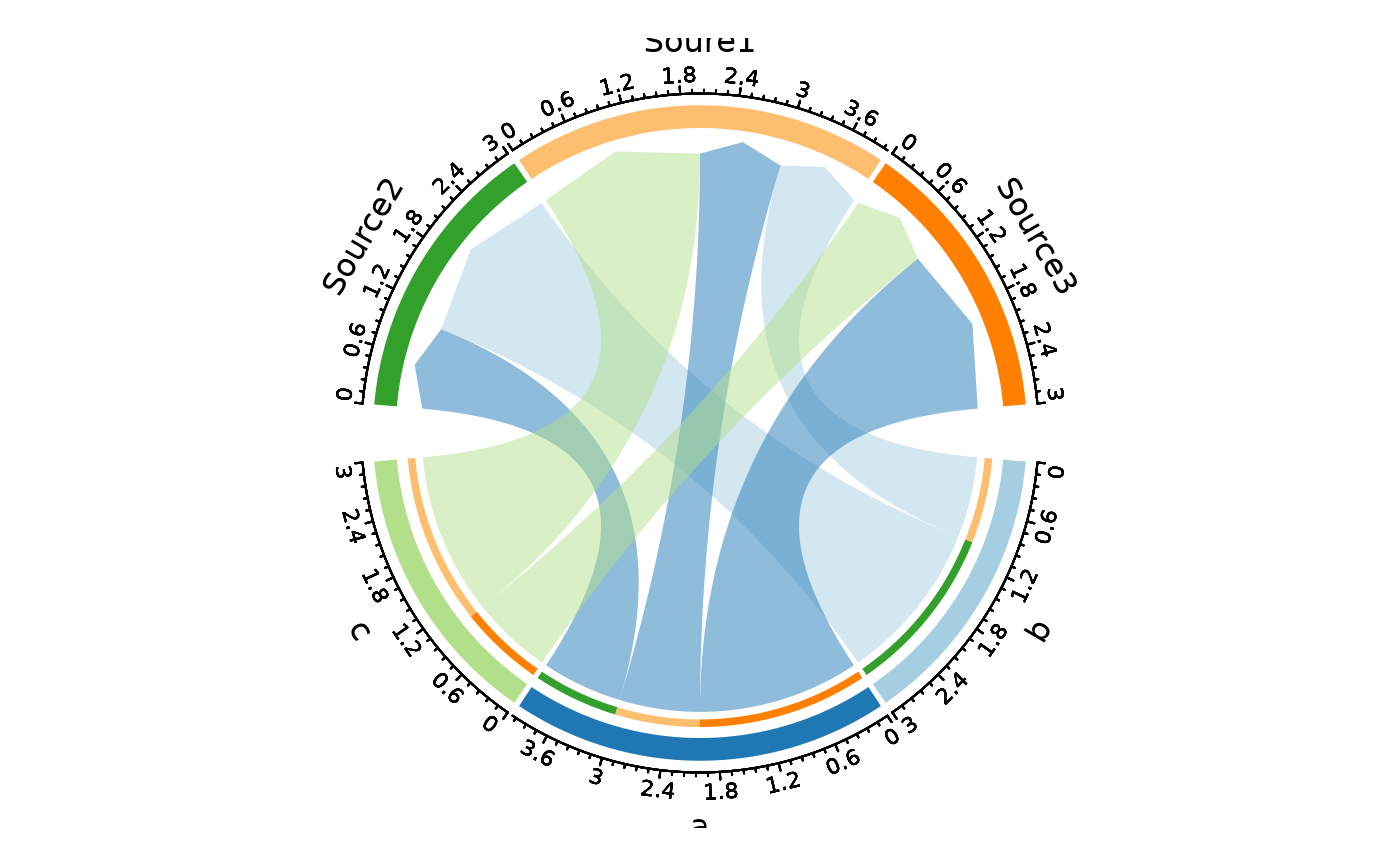
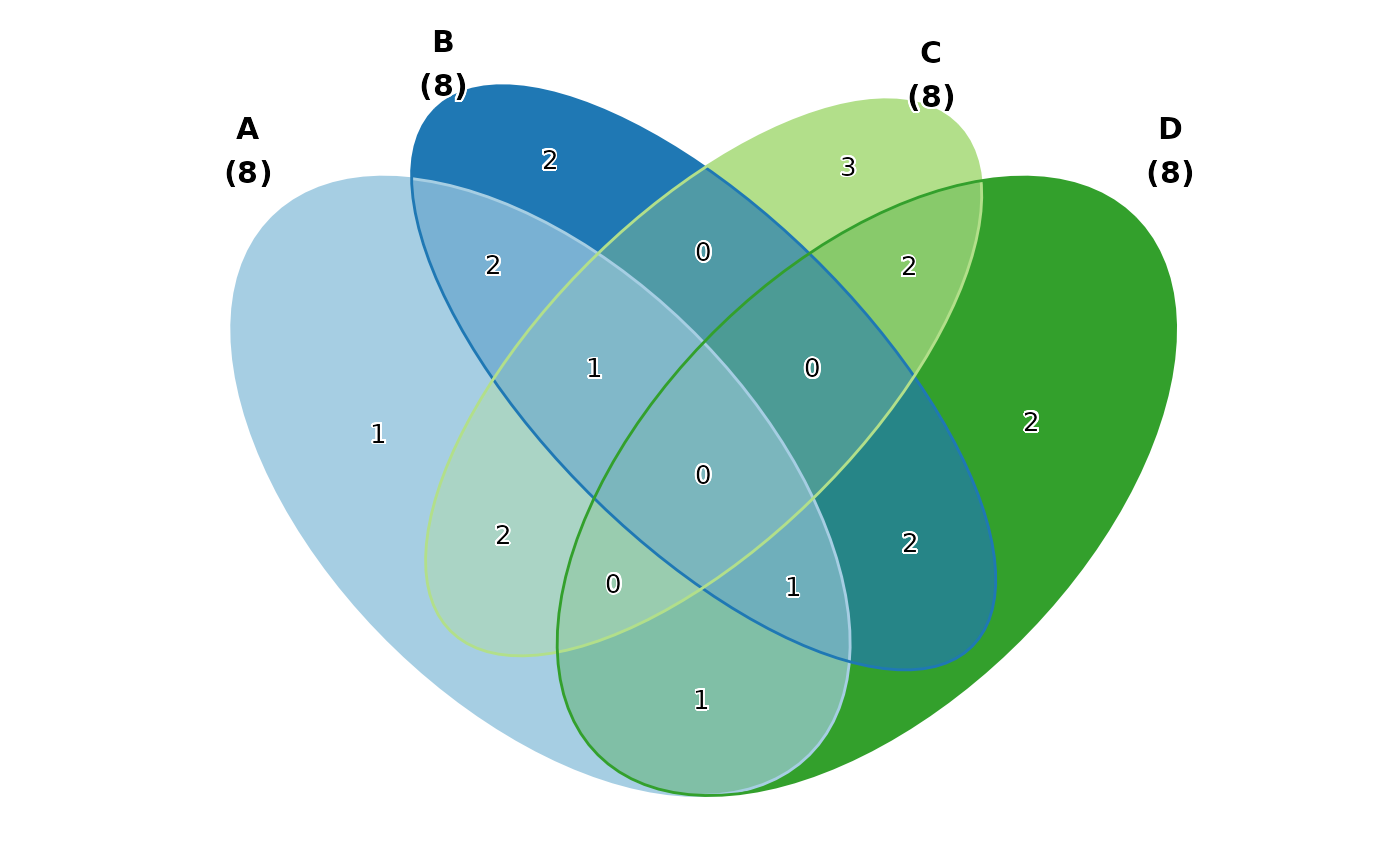
I like the ChordPlot and VennDiagrm it could generate.
This package maybe helpful for beginners or people without much knowledge of ggplot2.